The Overview tab in the FlexiFunnels dashboard provides a snapshot of your funnel’s daily performance and helps you track essential business metrics in real time. It’s the default screen you land on and is ideal for quick performance checks and decision-making.
Time Filters
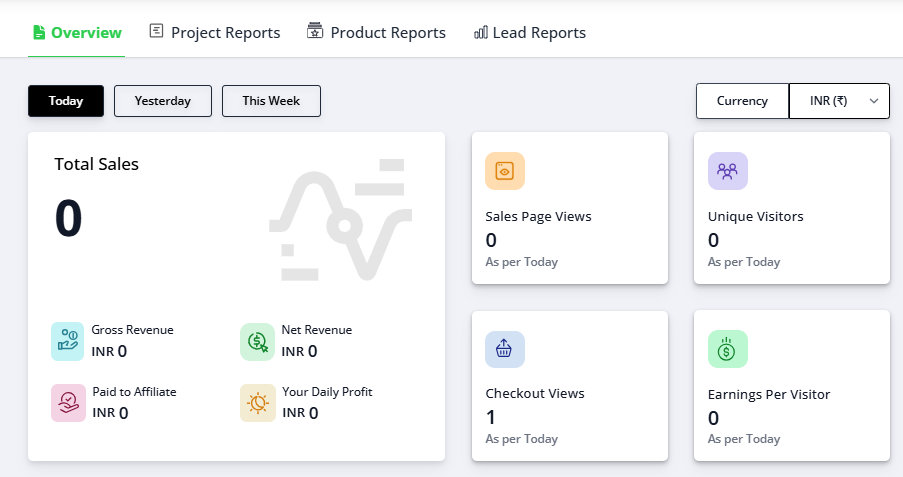
At the top, you can toggle between:
Today (default view)
Yesterday
This Week
These filters allow you to track performance metrics over different timeframes with a single click.
Sales Performance Summary
The left section of the dashboard highlights your sales stats for the selected period:
Total Sales: Number of completed transactions.
Gross Revenue: Total revenue before deductions.
Net Revenue: Revenue after all deductions.
Paid to Affiliate: Amount paid out to affiliate partners.
Your Daily Profit: Your actual earnings for the day.
This section gives you a clear idea of what you’re earning and how much is being shared with affiliates.
Traffic & Engagement Metrics
To the right, you’ll find data reflecting user behavior and engagement:
Sales Page Views: Number of times your sales page was viewed.
Unique Visitors: Number of distinct users who visited your funnel.
Checkout Views: Count of users who reached the checkout page.
Earnings Per Visitor (EPV): Total earnings divided by number of visitors, showing your funnel efficiency.
Currency Toggle
You can also change the currency display using the dropdown in the top right. In this example, it's set to INR (₹).
Use This Section To:
Monitor real-time sales performance.
Analyze visitor-to-sale conversion flow.
Measure your funnel’s profitability per visitor.
Track how affiliate commissions impact your revenue.
Was this article helpful?
That’s Great!
Thank you for your feedback
Sorry! We couldn't be helpful
Thank you for your feedback
Feedback sent
We appreciate your effort and will try to fix the article